Executive Summary
A Maharashtra-based steel manufacturer was presented with a 120 MWp Open Access Solar project under a Group Captive structure. The paper returns were staggering: a 91.49% IRR on equity and ₹2.89/unit in direct savings. Yet, when the CFO asked for a ₹37.49 Cr equity investment, the Board refused to approve it.
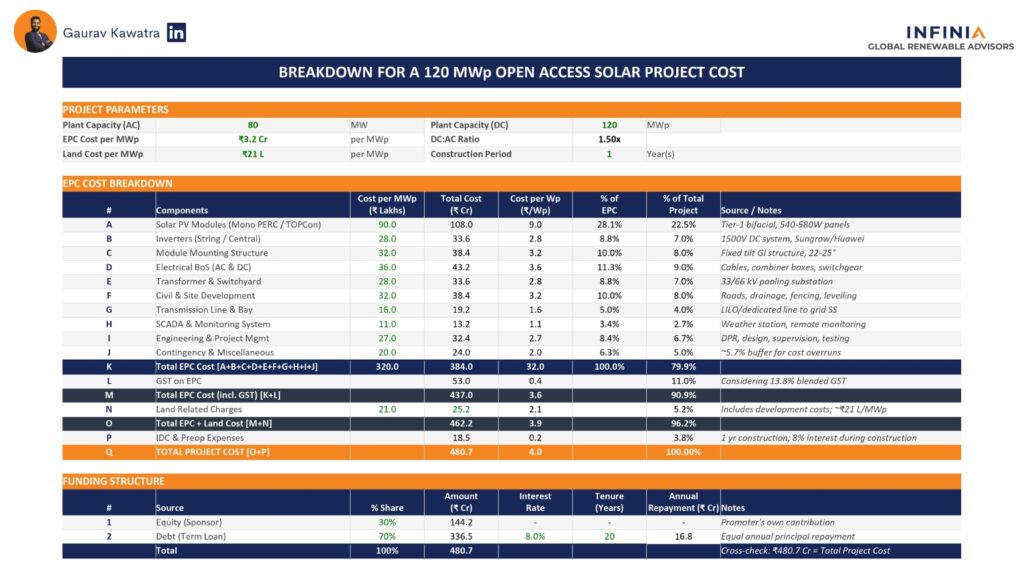
They didn’t reject the project; they rejected the lack of forensic transparency regarding the ₹480.7 Cr Total Project Cost. By intervening and building a “Board-Ready Cost Anatomy” framework, we decoded every rupee, percentage, and hidden component. The result? The CFO returned to the boardroom with absolute clarity, securing unanimous approval for the capital expenditure. Here is the exact breakdown of how we did it.
The Pitch: A “No-Brainer” on Paper
When a CFO walks into a boardroom to pitch a Renewable Energy transition, the initial focus is almost always on the top-line financial metrics. For this specific steel company, the numbers for the proposed 120 MWp Open Access Solar project were incredibly compelling:
- Total Project Cost: ₹480.7 Cr
- Equity Investment Required: ₹37.49 Cr
- Projected Savings: ₹2.89 per unit
- IRR on Equity: 91.49%
The Board was happy with the projected savings. They liked the massive 91.49% internal rate of return. For a capital-intensive industry, securing cheap, green power is a strategic imperative.
But they didn’t approve the investment. Not yet.
The Reality Check: The Board’s Sharp Mandate
A high-level spreadsheet is never enough to justify a ₹480.7 Crore capital decision. The Board drew a line in the sand and demanded complete, forensic transparency.
They asked a series of very sharp, specific questions:
- The Cost Breakup: What are the exact components that make up the ₹480.7 Cr project cost?
- The Tax Impact: How does taxation impact the total project cost across different line items?
- Hard vs. Soft Costs: What portion is strictly “hard cost” (land, modules, equipment) versus “soft cost” (services, approvals, and financing)?
- The Capital Structure: What is the exact debt-equity structure, and how is the developer facilitating it?
The Board made their stance absolute: “Until we get answers to these questions, we will not approve this investment.”
The Forensic Anatomy: Decoding the ₹480.7 Cr
The CFO took on this challenge and reached out to us. He needed to decode the Board’s exact questions and return with a framework that left zero blind spots.
We built the exact “Cost Anatomy” table for him. We mapped every component, separated the hard assets from the soft liabilities, detailed the exact taxation impact, and clarified the debt-to-equity ratio.
(Note: The numbers in the final table should be illustrative but boardroom-accurate to protect confidentiality).
The Verdict: Total Transparency Equals Unanimous Approval
He took this framework back to the Board. This time, they saw the full picture—every component, every percentage, every single rupee accounted for.
Because the financial risk was entirely demystified, the Board approved the ₹37.49 Cr equity investment unanimously.
When the Board asks, “Where exactly does the ₹480 Cr go?”, you must have the answer ready. Not after the meeting. Before it. —
Next Steps for the Boardroom
If you are preparing your next Board presentation for an Open Access Solar project, do not rely on a basic developer proposal. You need a ready reckoner to decode your total project cost.
If you want to know how project costs change when you scale from 120 MWp to 300 MWp or 500 MWp, and how economies of scale actually come into play, we can help.
About Infinia Solar
Infinia Solar is India’s leading renewable energy consultant.
We help Commercial and Industrial consumers procure the right renewable energy solutions, from the right developers, and on the right PPA terms.
We’ve served 60+ customers across 18 states, enabling 1.4 GW of open access and rooftop solar capacity, and have facilitated 150+ PPAs so far.
This has helped our customers reduce up to 50% of their electricity costs and replace up to 100% of their power with renewable energy.
We have also collaborated with 50+ developers, and our customers fondly refer to us as the ‘Amazon of the renewable energy industry.‘