Executive Summary
Securing a boardroom mandate for an 80% Renewable Energy target is only the first step. The real battle begins when deciding how to finance it.
In October 2025, the board of a massive Rajasthan-based textile manufacturer sat down to procure a 30 MWp Open Access Solar solution. The mandate was clear: hit the 80% RE target while drastically crashing power costs. However, the decision immediately triggered a boardroom war between the Managing Director and the CFO over the financial structure.
The dilemma? A ₹33.3 Crore pure CAPEX model yielding a 34% IRR versus a ₹9 Crore Group Captive structure driving a 52% IRR. One prioritized maximum Net Present Value (NPV) and ownership; the other prioritized cash preservation and risk mitigation. Here is the exact framework we used to settle the debate.
The MD’s Argument: The CAPEX Model (Maximum NPV)
The Managing Director looked at the company’s healthy balance sheet and saw an opportunity for outright ownership. His preference was a 100% CAPEX structure.
His rationale was aggressive and financially valid:
- Deploy Cash: The company had surplus cash on the balance sheet, so why not deploy it into a high-yielding hard asset?
- Tax Shields: By owning the asset, the company could avail the 40% accelerated depreciation (AD) tax shield and claim GST benefits.
- The Ultimate Cost: By taking full ownership, he projected they could crash the landed cost of power to an astonishing ₹1.36 per unit.
For the MD, the game was about total control and maximizing the absolute Net Present Value (NPV) of the savings over 25 years.
The CFO’s Argument: The Group Captive Model (Risk Mitigation)
On the other side of the table, the CFO pushed back hard. His preference was an Open Access Group Captive structure. He did not want to sink ₹33.3 Crore into a power plant when their core business was textiles.
His counter-argument focused on capital efficiency and risk transfer:
- Preserve Cash: He wanted to deploy only the mandatory 26% equity required for captive compliance (roughly ₹9 Crore), keeping the rest of the capital liquid for core business expansion.
- Avoid Debt Servicing: Taking on heavy debt for the remaining CAPEX portion meant servicing loans—a rigid financial burden he wanted to avoid.
- Offload the Risk: Most importantly, he wanted a peaceful night. A Group Captive model offloads 100% of the OPEX, generation risk, and business risk to a third-party developer.
For the CFO, the game was about maximizing the IRR (52%) while ruthlessly mitigating operational risk.
The Verdict: Return vs. Risk
The CFO reached out to us for an independent advisory to break the deadlock. We mapped the exact data for both structures for this 30 MWp project.
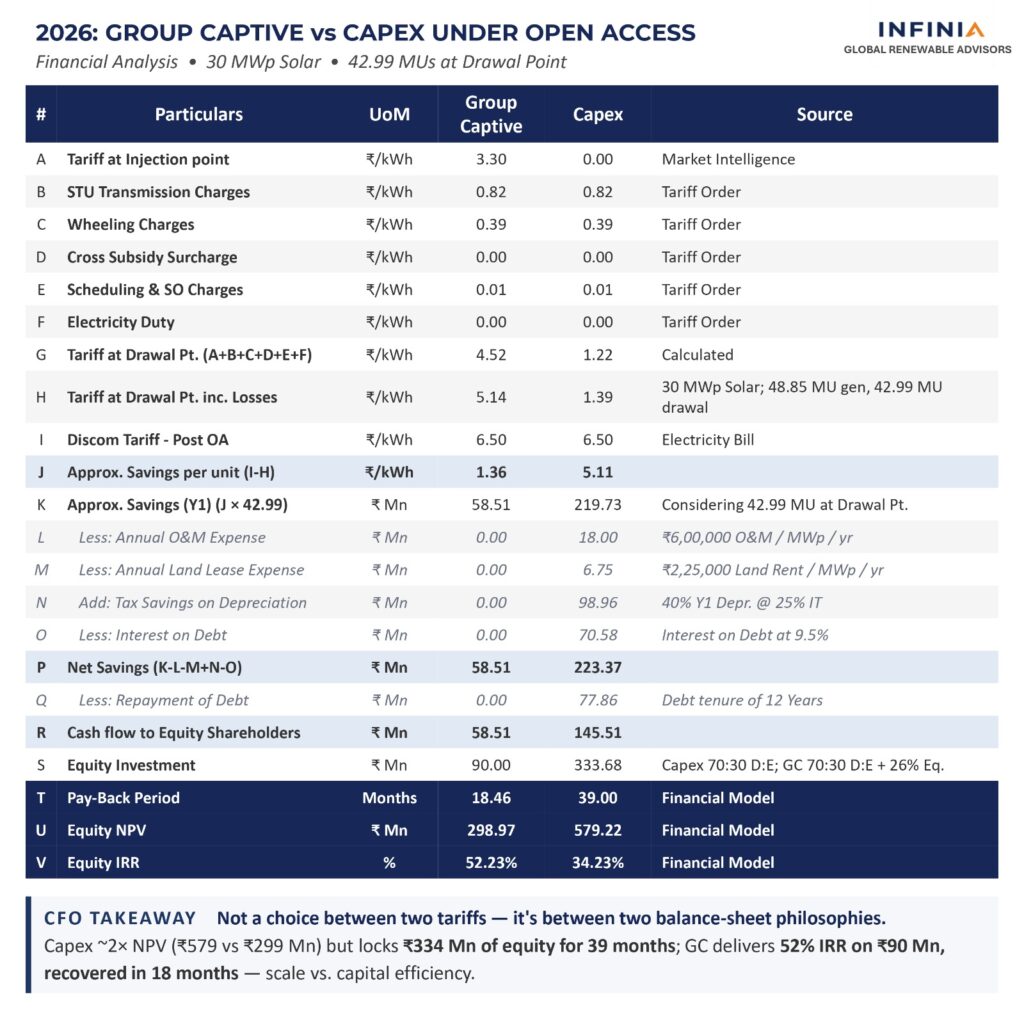
The framework made the trade-off crystal clear. The CAPEX route delivers higher absolute lifetime savings (NPV) but forces the corporate balance sheet to absorb all execution and generation risks. The Group Captive route requires a fraction of the capital, delivers a vastly superior IRR (52% vs. 34%), and legally shields the company from operational headaches.
The ultimate choice depends entirely on a company’s internal cost of capital and appetite for risk.
Next Steps for the C-Suite
If your Board is deadlocked over how to finance your next major Renewable Energy procurement, do not rely on generic developer pitches. You need mathematically sound, buy-side clarity.
If you are evaluating a CAPEX vs. Group Captive structure and want us to run a Techno-Commercial Wealth Audit to map your exact savings, payback, and IRR before you commit capital:
In this session, we will audit your exact financial structures so you can walk into your next Board meeting with a definitive, mathematically unassailable energy strategy.
About Infinia Solar
Infinia Solar is India’s leading renewable energy consultant.
We help Commercial and Industrial consumers procure the right renewable energy solutions, from the right developers, and on the right PPA terms.
We’ve served 60+ customers across 18 states, enabling 1.4 GW of open access and rooftop solar capacity, and have facilitated 150+ PPAs so far.
This has helped our customers reduce up to 50% of their electricity costs and replace up to 100% of their power with renewable energy.
We have also collaborated with 50+ developers, and our customers fondly refer to us as the ‘Amazon of the renewable energy industry.‘